
Category: IGCSE Biology posts
Beware YouTube – “Sexual Reproduction in Plants Video”
This video illustrates clearly why you have to be careful using YouTube to find information for revision. It is produced by a company in Australia and is clearly presented, includes the right level of detail for GCSE in the UK and is easy to follow. But….
The video reinforces one of the commonest areas of confusion in this topic by its choice of images to accompany the text. In the section when the voice over is describing the role of animals in seed-dispersal, it has an image of a bee feeding on pollen in a flower. This is NOT seed dispersal!
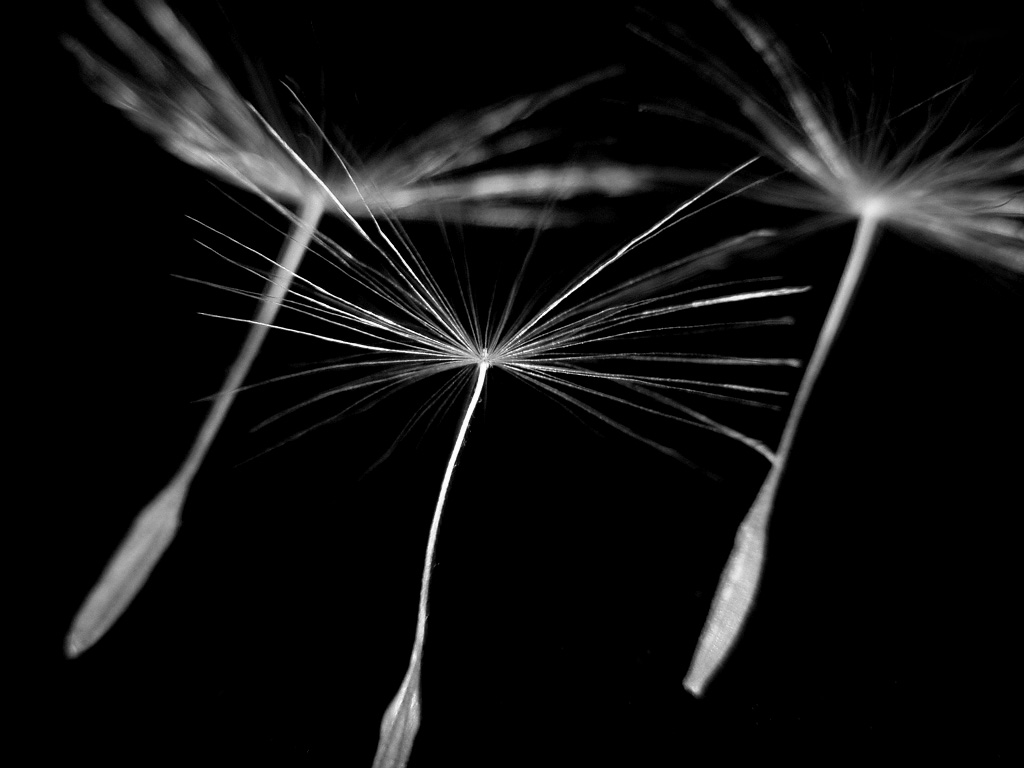
Later in the video when the voice over talks about wind-pollinated flowers, there is an image of the seeds of a dandelion being blown by the wind. This is NOT pollination!
It might seem like a small point but when you have marked exam questions on this topic for 20 years and seen many students confuse these two separate processes, it starts to take on more significance. So please watch YouTube for science videos – there are some great resources on there…. But be critical and remember, just because it is on a video, it doesn’t mean it is correct!

Asexual Reproduction in Plants – Grade 9 Understanding for IGCSE 3.1 3.7
The previous posts have explained the processes involved in sexual reproduction in plants. But many species of plant can also reproduce asexually and this post is going to explain how and why this might occur… Now this is not a topic that is so exciting that it keeps many GCSE students awake at night but there is some good biology in here so pay attention!
Asexual reproduction is the term used for any reproductive strategy that produces genetically identical offspring. The term for a group of genetically identical organisms is a clone and so asexual reproduction is also called cloning. In animals and plants, asexual reproduction only involves one type of cell division, mitosis.
Sexual reproduction on the other hand always introduces genetic variation into the offspring. In the majority of cases, it involves the formation of two haploid gametes (produced in a specialised type of cell division called meiosis) which then fuse together in fertilisation to form a zygote.
This post is not the correct place to discuss the advantages and disadvantages of the two types of reproduction. But sexual reproduction comes at a cost for an organism: in plants this cost is the energy spent making attractive petals and scent to attract insect pollinators, the cost of wasting millions of pollen grains just to ensure some are transferred, the cost of making sweet tasty fruits for animals to eat. I am writing this the day after Valentine’s Day in the UK which illustrates the courtship costs for animals quite well…..
Asexual Reproduction in Plants:
Plants have evolved a variety of asexual strategies shown in the picture above. We only really need to consider one for your iGCSE exam and that is runners. Some plants, the classic example is the strawberry grow long horizontal stems outwards from the parent plant. When this “runner” touches the ground, root development is switched on and a new plant starts to grow upwards. When the runner dies back, you are left with two genetically identical plants, hence Asexual Reproduction.
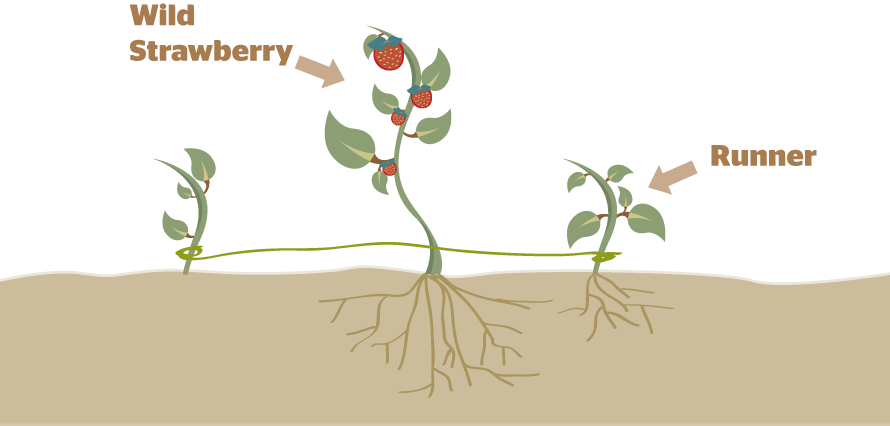
(This diagram is a little misleading…. The runner is not the name of the offspring plant, it is the long horizontal structure growing outwards just above the soil from the parent plant)
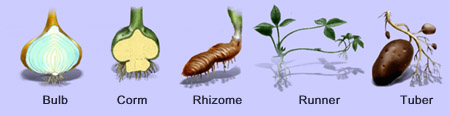
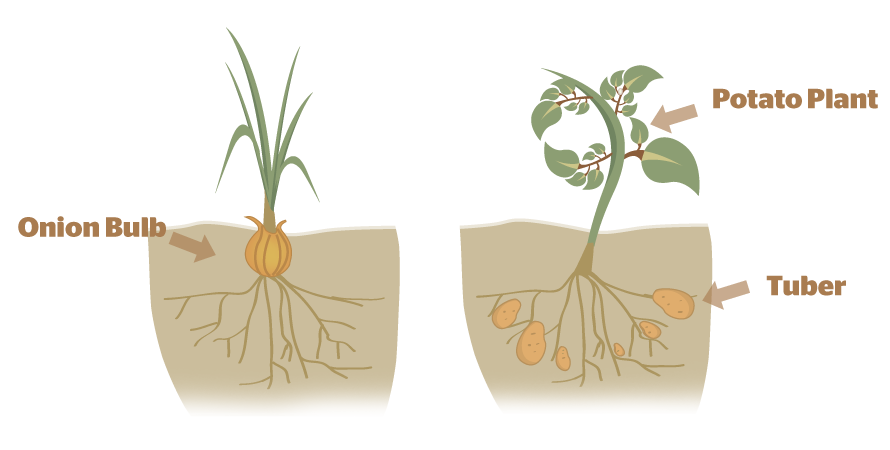
If you are really interested in learning more about asexual strategies in plants, well you should probably get out more… But you could study how tubers (such as in potato) and bulbs (such as the onion) allow plants both to over-winter and also produce clones.
Artificial Methods of Asexual Reproduction in Plants
This is quite weird if you think about it….. A human can cause asexual reproduction in many species of plant by “taking a cutting“. As the name suggests this involves cutting off a small part of the plant (including a leaf and part of the stalk) and then sticking it into soil to grow a new plant. The only type of cell division in this process is mitosis and so the plant produced from the cutting will be a clone of its parent (genetically identical).
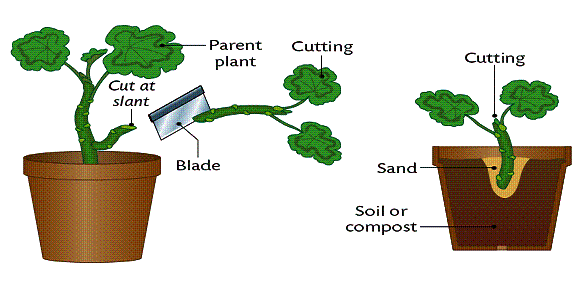
This is an example of artificial asexual reproduction in plants. It is a useful strategy for gardeners as it allows you to produce lots of new plants for your garden without shelling out hard-earned cash at the garden centre….
Cuttings work much better if in between taking the cutting and planting it in a small pot of compost, the cut end of the stalk is dipped in a mixture of chemicals calling a “rooting powder”
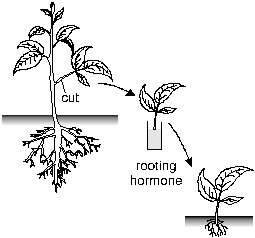
Rooting powder contains a mixture of plant growth substances (sometimes incorrectly called hormones) that can switch on the genetic programme of root production.
I hope you find this post useful. It probably holds the record for the dullest site anywhere on the World Wide Web…. Typing this has made me feel sleepy, so I am going to lie down…..
Please add comments/questions or tweet me if anything is unclear.

Sexual Reproduction in Plants (2) – Grade 9 Understanding for IGCSE Biology 3.4
In the previous post, I looked at the flower structure of both insect and wind pollinated flowers and explained the process of pollination. Now we need to ask “What happens next….?”
When a flower has been pollinated, there will be pollen grains that have landed on the stigma. These might be from a different species of plant in which case, nothing will happen. If they are from a different individual of the same species of plant, then triggered by sugary chemicals on the stigma the pollen grain starts to grow a tube called a pollen tube (imaginative people these plant biologists…..) which grows down through the style.

Pollen tube growth through the style is a complex process and the exact mechanism by which the pollen tube “knows” in which direction to grow is not completely understood. But it does know and grows down through the style and enters the ovule through a tiny opening in the ovule called the micropyle.

Now this is where it gets complicated …… but luckily for your exam, you don’t need to learn about the weird way plants undergo fertilisation. But to give you a taste, the male gamete which is a nucleus in the pollen grain divides on the way down the pollen tube to form two sperm nuclei (see diagram above). Each of these nuclei will fertilise a different nucleus in the ovule, hence the name double fertilisation.
But let’s keep it simple. There is a haploid female gamete called an egg cell inside the ovule and one of the haploid sperm nuclei from the pollen grain will fuse with it in the process of fertilisation. This produces a diploid cell called the zygote that will later develop into the embryo plant.
Quick reminder: Haploid is a term that refers to a cell that only has one member of each pair of chromosomes. Gametes are haploid cells and when two gametes fuse they produce a cell with pairs of chromosomes and this cell is described as Diploid.
The egg cell inside the ovule is now fertilised. It has a full set of chromosomes and is now called a zygote. So what happens to the structures in the flower…? After fertilisation the petals, sepals, stamens, stigma and style all dry out and wither. The ovary develops into a structure called the fruit and inside the fruit, each ovule develops into a seed.
Seeds are tough structures that have evolved to allow the embryo plant to undergo a period of dormancy before the seed germinates. The function of fruit is seed dispersal. It is vital for the parent plant that its offspring do not start to grow right next to themselves as they will be in direct competition with the parent for water and minerals from the soil and for sunlight. For animals it is easy for the parent to get rid of their offspring – they simply kick them out of the nest or send them to boarding school to get them out of the house…. Plants need to rely on more ingenious strategies….
In some plants the fruit has evolved to disperse the seed using the wind. Sycamore seeds have a propellor blade to slow down their fall from the tree. Dandelions give each seed a tiny parachute and can be carried for many miles in the wind.
But animals are more commonly used as couriers to get the seeds away from the parent plant. The fruit may be sweet and attractive to eat; the fruit may have hooks or barbs to get stuck to the animals body. Many seeds are dispersed by animals in a wide variety of ways…
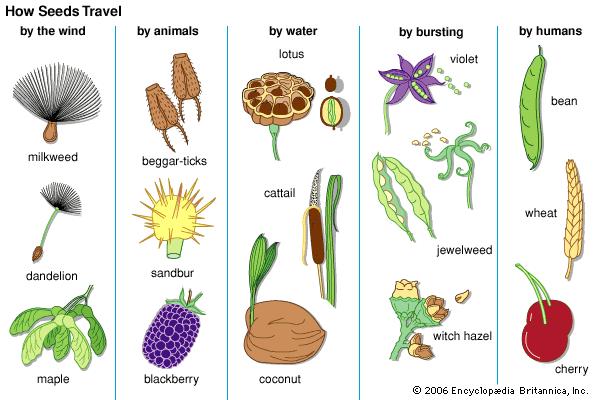
It is really important not to get confused between the role of animals as pollinators of flowers and their separate role in seed dispersal. Keep these two processes (pollination and seed dispersal) clearly separated in your notes and in your mind. In the stress of the exam, candidates often get muddled and so write nonsense….. This is something to avoid if possible!
PMG tip: organise your notes on plant reproduction into the following subheadings to keep things separate.
- Flower Structure
- Pollination
- Fertilisation
- Seed Dispersal
- Germination

Sexual Reproduction in Plants (1) Grade 9 Understanding for IGCSE Biology 3.3
Sexual reproduction in plants is a topic that some students find difficult at iGCSE. Perhaps it is the plethora of jargon terms, perhaps there are one or two complex ideas to master, perhaps it is just because some people just aren’t interested in plants (more fool them…) Anyway this post will attempt to cover all the main ideas needed for an A* understanding…. Flower structure The flower is the reproductive organ of the plant. A key difference in reproductive biology between animals and plants is that the majority of plants are hermaphrodite. Hermaphrodite means “an organism able to produce both male and female gametes”.

The male gamete in plants is a nucleus found inside a pollen grain, the female gamete is an egg cell nucleus found inside a structure called an ovule in the ovary of the flower. The male parts of the flower are called stamens. Stamens are made up of the pollen-producting anther supported on a stalk called the filament. The female part of the flower is called the carpel. The carpel is made of a stigma (adapted for receiving pollen), a thin style and a swelling at the base called the ovary. Inside the ovary are one or more smaller structures called ovules that contain the egg cells, ova that are the female gamete. The flower also has petals, often brightly coloured and scented to attract insects and that are protective structures that cover the flower when it is still a bud.

Pollination is the “transfer of pollen from the anther to the stigma“. Please learn this definition! A few plants (such as the garden pea) self-pollinate. This means pollen grains from one flower stick to the stigma of the same flower. If you want to irritate me in class, tell me that this is a type of asexual reproduction because only one parent is involved. I will respond with a strange facial grimace and a low guttural growl…… You have been warned. A plant that self-pollinates is still undergoing sexual reproduction as it is making gametes (by meiosis so every gamete will be genetically different) and then fertilising them in a random process. The offspring of self-pollination will still be genetically different from each other but the total genetic variation will be less than if DNA from two different individuals is used.
The vast majority of plants cross-pollinate. They transfer pollen from the anther of one flower to the stigma of a flower on a different plant. Cross-pollination can be brought about by a variety of mechanisms but the commonest two in the UK are by insects and by the wind.
The diagrams above all show flowers that are pollinated by insects. But look at this flower.

The stamens are large and hang outside the flower. The petals are green and small. The stigma is also hanging outside the flower and is large and feathery. This is a flower of a grass plant and typical of a wind-pollinated species.


Understanding Pedigrees: Grade 9 Genetics for IGCSE Biology 3.24
Sometimes genetics problems are based around a pedigree diagram. These diagrams show the phenotypes of individuals over several generations and allow deductions to be made about certain individuals phenotypes. Often pedigrees are used to show the inheritance of a particular disease in a family.

You can see that circles in the pedigree represent females, squares represent males. If the symbol is filled in, then the person suffers from the disease. Empty symbols represent people who do not have the disease.
Have a look at the pedigree above? What does this tell you about the disease?
Well the first and most obvious thing is that this disease is caused by a recessive allele, h.
If you see two people who don’t have the disease producing one or more children who do, then this must be a genetic disease caused by a recessive allele. In the top generation, parents 1 and 2 do not have the disease, but they have three children 2,3,4 one of whom has the disease.
What does this tell us about the genotype of parents 1 and 2 in generation I? Well if neither have the disease and they have a child who does, both 1 and 2 in the top generation must be heterozygous – Hh
Anyone with the disease must be homozygous recessive hh.
Have a look at generation II in the diagram above?
The man, number 2, who is a sufferer and so genotype hh marries woman 1 who does not have the disease. They produce 4 children, three with the disease and one without. What must the genotype of the woman 1 be? Well she must be heterozygous Hh. How do we know? What children would she produce if she were a homozygous HH woman?

A pedigree caused by a dominant allele would look very different. Every sufferer would have at least one parent who also suffers from the disease. Two sufferers producing some children who do not have the disease is indicative of a disease caused by a dominant allele. If we use the symbol P for the dominant allele that causes the disease, and p for the recessive allele that is “normal”, can you work out the genotypes of all 12 people on the diagram above?
- Pp
- Pp
- pp
- Pp
- PP or Pp
- PP or Pp
- pp
- pp
- Pp
- pp
- pp
- pp

Grade 9 GCSE Genetics: avoid a common error in understanding at IGCSE 3.19
There are one or two things which make a biology teacher’s (and indeed an exam marker’s) blood pressure rise. Well in fact in my case there are many dozens of things, as some of you know, but let’s keep it to the things candidates write in genetics answers in exams. This post is an attempt to encourage you to avoid the commonest “howler”.
The dominant allele does not have to be the more common one in a population.
Just because an allele is dominant, it does not mean it will be the most common in a population. I often hear answers in which people think that in a population 3/4 of the population will have the dominant phenotype, 1/4 will be recessive. This is utter nonsense of course. The ratio of 3:1 only applies to the probabilities of offspring produced by mating two heterozygous individuals.
There is a gene in humans in which a mutation can cause polydactyly: this rare condition results in babies born with an extra digit on each hand. Anne Boleyn was a famous sufferer in the past. But the allele of the gene that causes polydactyly is dominant – it is a P allele. I would imagine everyone reading this post, (all 12 of you…..), will probably have the genotype pp. The p allele that causes a normal hand to form is very very common in our population whereas the P allele is very very rare.
Don’t ever believe that just because an allele is common, it must be dominant.

How to score full marks on a genetics question in IGCSE Biology? 3.20, 3.23, 3.25
Few things in life are certain, famously just death and taxes. Northampton Town flirting with relegation can perhaps be added to this list. But you can be pretty certain that tucked away somewhere in your iGCSE Biology exam there will be a genetics question that asks you to draw a genetic diagram. There are usually four or even five marks available and so learning how to ensure you get all these marks is vital in your quest for an A* grade.
GCSE candidates are terrible at doing genetic diagrams: they fill the space with messy scribbles, doodles, strange tables and lines and then confidently write 3:1 at the bottom… Not a recipe for success. So learn how to do it, be neat, take your time and you can guarantee full marks.
If the question doesn’t do it for you, you should start by defining what the letters you will use for the alleles. If one allele is dominant over the other, it is conventional to use the upper case letter for the dominant allele, the lower case letter for the recessive one. It will tell you in the question which allele is dominant.
Start your genetic diagram by writing the phenotype of the parents in the cross.
e.g. Parental Phenotype: Tall Tall
Underneath the phenotype, write the genotype of the parents.
Parental Genotype: Tt Tt
Then you need to think about which alleles are present in the gametes. Gametes are haploid and so will contain one of each pair of homologous chromosomes – in this example there can only be one allele in each gamete (as we are only looking at one gene)
Gametes: T t T t
Next show random fertilisation. I think it is much better to draw a Punnett square that has the male gametes down one side, the female gametes down the other and then carefully pair them up. This is a stage where mistakes can be made if you rush so however simple you think this process is, take your time…..
Random Fertilisation
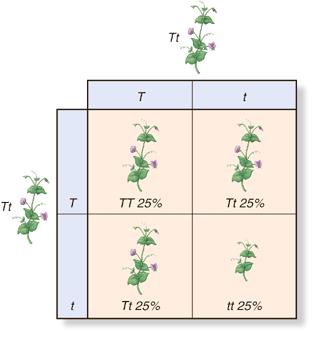
Finally you need to copy out the offspring genotypes from your Punnet square, like so
Offspring Genotypes: TT Tt Tt tt
And underneath each one, write the offspring phenotype
Offspring Phenotypes: Tall Tall Tall Dwarf
Finally, answer the question. If it asks for a probability, express your answer as either a percentage or a decimal or a fraction. So if I were asked what is the probability of a homozygous pea being produced, the answer is 50% or 0.5 or 1/2
Follow these rules and you will always score full marks – happy days……..

Genetics jargon: Grade 9 Understanding for IGCSE Biology 3.20
The science of genetics looks at how inherited characteristics are passed from one generation to the next. The father of genetics was the Moravian monk, Gregor Mendel, who showed with his breeding experiments in peas that individual, discrete “particles” are passed from one generation to the next. We now know that these “particles” are actually small sections of a DNA molecule called genes.
Mendel worked out that there were always two such “particles” in any cell which acted together to determine the feature described. But he knew that gametes (sex cells such as pollen grains and egg cells) only contained one “particle” for each feature. You should understand why this is.
The discrete particles that are passed from generation to generation are genes: these are sections of a DNA molecule and are located on chromosomes. Chromosomes in most organisms are found in pairs within the nucleus of a cell. The word for a cell that contains pairs of homologous chromosomes is a diploid. The gametes do not have pairs of chromosomes: they are haploid cells that contain one member of each pair. This ensures that at fertilisation when two gametes fuse, a diploid zygote is produced.
iGCSE candidates can find genetics a difficult topic and one reason is that there is lots of jargon. Have a look at my definitions for these jargon words and ensure that you understand what they mean. Genetics is not a topic in which rote learning and memorisation are helpful – the very top candidates at iGCSE will understand what is going on, and can then answer all possible questions with ease.
Gene: ” a section of a DNA molecule that codes for a single protein”
Allele: “an alternative version of a gene found at the same gene locus”
Gene locus: “the place on a chromosome where a particular gene is found”
Phenotype: “the appearance of an organism, e.g tall, short, blue eyes etc.”
Genotype: “the combination of alleles at a single gene locus that an organism possesses – e.g TT, Tt”
Homozygous: “a gene locus where the two alleles are identical is said to be homozygous – e.g. TT, tt”
Heterozygous: “a gene locus where the two alleles are different is heterozygous – e.g. Tt”
Dominant allele: “a dominant allele is the one that determines the phenotype in a heterozygous individual”
Recessive allele: ” a recessive allele can only determine the phenotype in a homozygous individual”
Codominance: “two alleles are codominant if they both contribute to the phenotype in a heterozygous individual”

Enzymes: Grade 9 Understanding for IGCSE Biology 2.10 2.11 2.13
Enzymes are biological catalysts. This means they are able to increase the rate of a chemical reaction but are not used up in the reaction. Without enzymes the reactions of metabolism would all happen too slowly for life to exist – enzymes can speed up the rate of reaction by many millions of times….
Enzymes work as catalysts by lowering the activation energy needed for the reaction to occur. Activation energy is the term for the extra energy needed to be given to the reactants to break bonds within them to allow the product molecules to be formed. Enzymes provide an alternate reaction pathway that has a lower activation energy. This means that under any conditions a higher proportion of the reactant molecules will have sufficient energy to overcome the activation energy barrier and so more reactants will be turned into products.
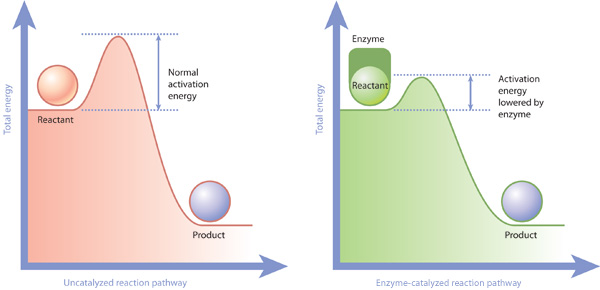
How do enzymes lower the activation energy?
Enzymes are all large globular molecules, almost always made of protein. They have a specific three-dimensional shape that includes a region called the active site which has a shape that allows the reactant molecules (called substrates) to bind. When the enzyme binds to the substrate, it forms an enzyme-substrate complex.

This theory of how enzymes might work is called the Lock and Key theory. The active site acts like a lock as it has a shape that is complementary to the shape of the substrate (the key). Lock and Key theory explains an important property of enzymes which is that they are specific. Each enzyme can only catalyse one reaction since only a substrate molecule with a specific shape can bind to the active site.
When the substrate is bound to the active site forming an enzyme-substrate complex, the enzyme introduces a strain on some of the bonds in the substrate, making a reaction more likely. The active site might provide a microenvironment that is exactly the right condition for the reaction, thus lowering the activation energy.

Key idea: enzymes catalyse almost all the chemical reactions that happen in organisms. It is easy to imagine that enzymes only catalyse reactions like the one in the picture above in which a molecule is being broken down into smaller molecules. But enzymes catalyse oxidation reactions, condensation reactions in which big molecules are built up from smaller ones, phosphorylation reactions (sticking phosphate groups onto molecules) and so on and so on. So don’t describe enzymes as being involved in breaking things down: some do of course but the vast majority work inside cells to catalyse a whole variety of reactions in metabolism.
Rates of enzyme-catalysed reactions can be affected by Temperature
The temperature of the reaction has a significant effect on the rate of reaction. Look at the following graphs:

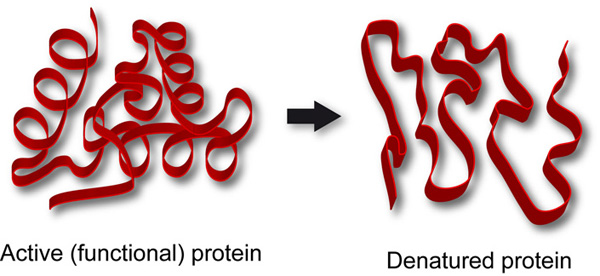
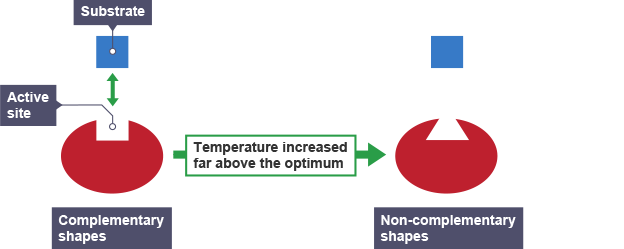
The pattern of this graph is characteristic of an enzyme catalysed reaction. At low temperatures the rate of reaction is low. This is because few enzyme-substrate complexes are formed per second as the enzyme and substrate molecules are moving around so slowly that they rarely collide. At temperatures above the optimum, the enzymes and substrate molecules will be moving very fast and so will be colliding all the time. So why is the rate so low? Well that is because high temperatures cause enzymes to denature. Remember enzymes are made of protein and proteins can have their 3D shape changed by high temperatures. If an enzymes’ 3D shape changes, the active site will change shape and if this happens the substrate cannot bind.
Rates of enzyme-catalysed reaction are also affected by pH
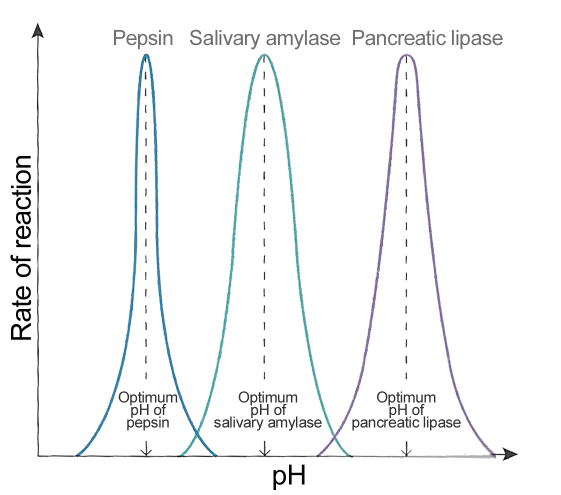
Enzymes tend to work in a very narrow band of pH values. pH is a measure of the acidity/alkalinity of a solution and most enzymes require an optimum pH to function well. The rate of reaction drops very rapidly on either side of the optimum pH simply because extremes of pH will denature enzymes. The acid or alkaline environment can break the bonds that hold the enzyme in its specific 3D shape. An enzyme with a changed shape cannot function as a catalyst if the substrate cannot bind to the active site and so the rate falls away rapidly either side of the optimum.

Factors affecting rates of Photosynthesis (part 2): Grade 9 Understanding for IGCSE Biology 2.20 2.23
In the previous post on photosynthesis, you revised how there were four environmental factors that can affect rates of photosynthesis in a plant:
- light intensity
- light wavelength
- temperature
- carbon dioxide concentration
This post will explain the results from experiments with Elodea in which one factor is altered (the independent variable) and the other three are kept exactly the same (control variables)
Light intensity

The independent variable (light intensity) is on the x axis and the dependent variable (number of bubbles per minute) is on the y axis.
How do we explain the pattern in this graph?
As the light intensity increases the rate of photosynthesis increases. This is because a higher light intensity gives more energy to the chloroplasts and so more reactions can happen per second and the rate goes up. But beyond the orange dot on the graph, the increases in rate slows down until at around 12 units of light, adding more light has no effect on the rate. At these high light intensities some other factor is now the limiting factor as opposed to light intensity. The limiting factor remember is the factor in the shortest supply. So perhaps above 12 units of light photosynthesis is limited by the concentration of carbon dioxide. The only way to find the limiting factor is to repeat the experiment with more carbon dioxide and see whether the rate is higher above 12 units.
Light wavelength
Although this graph is not perfect, it does show how the rate of photosynthesis varies at different light wavelength.

Rates of photosynthesis peak in the blue-violet and red parts of the visible spectrum with a much lower rate in green light. The reason for this is that chlorophyll pigments do not absorb green light well.
Carbon Dioxide concentration

The pattern is similar to the light intensity relationship. When carbon dioxide concentrations are low, it is the limiting factor for photosynthesis and so increasing the concentration will increase the rate. As the graph levels off, some other factor is now the limiting factor – perhaps light intensity or temperature.
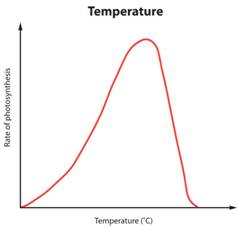
Temperature
Temperature is a factor that affects photosynthesis because of enzymes. Many reactions in photosynthesis are catalysed by enzymes and enzymes all have an optimum temperature.
This pattern is not explained by limiting factors. At low temperatures the rate is low because the enzymes and the substrate molecules are moving really slowly. This means there are few collisions between the substrate and the active site of the enzyme. As temperature increases, the rate increases as there are more collisions and more enzyme-substrate complexes are formed per second. But high temperatures denature enzymes: the bonds that hold the enzyme in its precious 3-D shape are broken and the enzyme molecule unravels. So the active site may either change shape or may be lost as a catalyst. This slows the rate down to an extremely low rate.
