
Tagged: Mendelian genetics
Summary video for Genes and Genetics

Understanding Pedigrees: Grade 9 Genetics for IGCSE Biology 3.24
Sometimes genetics problems are based around a pedigree diagram. These diagrams show the phenotypes of individuals over several generations and allow deductions to be made about certain individuals phenotypes. Often pedigrees are used to show the inheritance of a particular disease in a family.

You can see that circles in the pedigree represent females, squares represent males. If the symbol is filled in, then the person suffers from the disease. Empty symbols represent people who do not have the disease.
Have a look at the pedigree above? What does this tell you about the disease?
Well the first and most obvious thing is that this disease is caused by a recessive allele, h.
If you see two people who don’t have the disease producing one or more children who do, then this must be a genetic disease caused by a recessive allele. In the top generation, parents 1 and 2 do not have the disease, but they have three children 2,3,4 one of whom has the disease.
What does this tell us about the genotype of parents 1 and 2 in generation I? Well if neither have the disease and they have a child who does, both 1 and 2 in the top generation must be heterozygous – Hh
Anyone with the disease must be homozygous recessive hh.
Have a look at generation II in the diagram above?
The man, number 2, who is a sufferer and so genotype hh marries woman 1 who does not have the disease. They produce 4 children, three with the disease and one without. What must the genotype of the woman 1 be? Well she must be heterozygous Hh. How do we know? What children would she produce if she were a homozygous HH woman?

A pedigree caused by a dominant allele would look very different. Every sufferer would have at least one parent who also suffers from the disease. Two sufferers producing some children who do not have the disease is indicative of a disease caused by a dominant allele. If we use the symbol P for the dominant allele that causes the disease, and p for the recessive allele that is “normal”, can you work out the genotypes of all 12 people on the diagram above?
- Pp
- Pp
- pp
- Pp
- PP or Pp
- PP or Pp
- pp
- pp
- Pp
- pp
- pp
- pp

Grade 9 GCSE Genetics: avoid a common error in understanding at IGCSE 3.19
There are one or two things which make a biology teacher’s (and indeed an exam marker’s) blood pressure rise. Well in fact in my case there are many dozens of things, as some of you know, but let’s keep it to the things candidates write in genetics answers in exams. This post is an attempt to encourage you to avoid the commonest “howler”.
The dominant allele does not have to be the more common one in a population.
Just because an allele is dominant, it does not mean it will be the most common in a population. I often hear answers in which people think that in a population 3/4 of the population will have the dominant phenotype, 1/4 will be recessive. This is utter nonsense of course. The ratio of 3:1 only applies to the probabilities of offspring produced by mating two heterozygous individuals.
There is a gene in humans in which a mutation can cause polydactyly: this rare condition results in babies born with an extra digit on each hand. Anne Boleyn was a famous sufferer in the past. But the allele of the gene that causes polydactyly is dominant – it is a P allele. I would imagine everyone reading this post, (all 12 of you…..), will probably have the genotype pp. The p allele that causes a normal hand to form is very very common in our population whereas the P allele is very very rare.
Don’t ever believe that just because an allele is common, it must be dominant.

How to score full marks on a genetics question in IGCSE Biology? 3.20, 3.23, 3.25
Few things in life are certain, famously just death and taxes. Northampton Town flirting with relegation can perhaps be added to this list. But you can be pretty certain that tucked away somewhere in your iGCSE Biology exam there will be a genetics question that asks you to draw a genetic diagram. There are usually four or even five marks available and so learning how to ensure you get all these marks is vital in your quest for an A* grade.
GCSE candidates are terrible at doing genetic diagrams: they fill the space with messy scribbles, doodles, strange tables and lines and then confidently write 3:1 at the bottom… Not a recipe for success. So learn how to do it, be neat, take your time and you can guarantee full marks.
If the question doesn’t do it for you, you should start by defining what the letters you will use for the alleles. If one allele is dominant over the other, it is conventional to use the upper case letter for the dominant allele, the lower case letter for the recessive one. It will tell you in the question which allele is dominant.
Start your genetic diagram by writing the phenotype of the parents in the cross.
e.g. Parental Phenotype: Tall Tall
Underneath the phenotype, write the genotype of the parents.
Parental Genotype: Tt Tt
Then you need to think about which alleles are present in the gametes. Gametes are haploid and so will contain one of each pair of homologous chromosomes – in this example there can only be one allele in each gamete (as we are only looking at one gene)
Gametes: T t T t
Next show random fertilisation. I think it is much better to draw a Punnett square that has the male gametes down one side, the female gametes down the other and then carefully pair them up. This is a stage where mistakes can be made if you rush so however simple you think this process is, take your time…..
Random Fertilisation
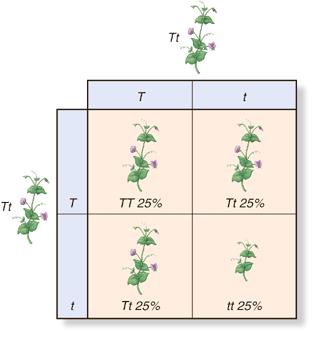
Finally you need to copy out the offspring genotypes from your Punnet square, like so
Offspring Genotypes: TT Tt Tt tt
And underneath each one, write the offspring phenotype
Offspring Phenotypes: Tall Tall Tall Dwarf
Finally, answer the question. If it asks for a probability, express your answer as either a percentage or a decimal or a fraction. So if I were asked what is the probability of a homozygous pea being produced, the answer is 50% or 0.5 or 1/2
Follow these rules and you will always score full marks – happy days……..
How to score full marks on IGCSE Genetics questions? 3.23 3.25
This will be my final blog entry from Dubai. I will be flying home tomorrow with spirits refreshed by this amazing country and the positive and dynamic people I have met.
There will be a Mendelian genetics question in one of the two EdExcel IGCSE Biology papers. Examiners are people who like to stick to tried and tested formulae with setting questions and it’s always worked in the past, so why change now…?
You should welcome the genetics question when it appears for two reasons:
- If you understand what is going on and
- if you are prepared to set the answer out correctly (see below)
you can almost guarantee that you will score all the marks! And that’s what we want as full marks = top grade
The understanding you need for these questions is actually quite detailed and beyond what I can explain in this post. Check your understanding by answering the following questions:
- What is the difference in meaning between a gene and an allele?
- Why does the genotype of a person, plant, fruit fly or rabbit contain two alleles for each gene?
- What is different about the genotype of a gamete compared with every other cell in the body? Why are gametes different?
- How would you explain what is meant by a recessive allele?
- If two alleles are codominant, what does this mean? Give me a specific example in which this pattern of inheritance is found.
Good, I am assuming you have answered these questions fully using important terms like diploid, homologous chromosomes, phenotype, heterozygous correctly……
In which case, all that remains is to remind you how to set out a genetic diagram. I am not usually a proponent of slavishly following protocols but in producing a genetic diagram in an exam, you certainly should. There are usually five marks available for a question like this and only one of the marks is for getting the right answer. 20% = E grade and that is not what we want.
- Start with the phenotype of the parents – write mother and father’s phenotype down in full
- Then underneath the phenotype, write the genotype of the parents. (The letters to use for the two alleles will be given in the question and always use the letters suggested, don’t make up your own. Slavish following of protocol remember)
- The next bit is the first tricky bit. Write the alleles present in the gametes. Remember gametes are formed by meiosis and so only contain one member of each homologous pair of chromosomes – they will only have one allele from each pair in each cell. Draw circles around each gamete to show the examiner you understand they are individual cells.
- Draw a fertilisation table (called a Punnett square after Reginald Punnett – who says you don’t learn anything useful at GCSE?)
- Write out the offspring genotypes from the table
- Write out the offspring phenotypes underneath your list of offspring genotypes showing how they match up.
Answer the question. If asked for a probability, express it as a fraction or percentage. Those of you who follow the horses are sometimes tempted to write the probability as odds, but “3-1 the dwarf rabbit, 3-1 on the field” is not a good answer in your Biology exam…
If you do this you will always get all the marks.
Please remember:
The ratio of 3:1 is only found in the offspring of two heterozygous parents. Sometimes students seem to think that all genetic crosses produce offspring in this ratio. This doesn’t make any sense if you think about it for a moment but in an exam, thinking for a moment is not always easy.
If you look at phenotypes in a population, the dominant phenotype is not always more common that the recessive phenotype. This is something people find really difficult to get their head around. Think of the disease polydactyly in which suffers have an extra digit (e.g. Anne Boleyn) Polydactyly js caused by a dominant allele but I bet in your class at school, people with 5 digits on each hand are more common than those with 6. (A joke about schools in the Fens north of Cambridge has been removed in the interests of good taste)
As fertilisation is random, offspring will never exactly fit the expected Mendelian ratio. If you are given a cross in which peas produce offspring and 495 are smooth and 505 are wrinkled, you do not have to work out some complicated theory to explain this ratio. It will be a 1:1 ratio with the small differences due to random fertilisation
Good luck and keep working hard! Comments welcome as always – it does show me that someone is reading this stuff…….
