
What’s the point of graphs? Help for IGCSE Biology
A student contacted me to ask “what’s the point of graphs?” I hope this short post may help.
A graph is just a way to visually represent the data you have collected in an experiment so it is easier to see any patterns. Some people can see trends and patterns just in a column of numbers, but I need a graph to show me exactly what is going on.
There are a few essential things when plotting a graph in an exam question. The examiners use the acronym SLAAP for allocating marks so students should be fully aware what these mark points stand for….
S stands for Scale: choose a linear scale on the two axes that means your graph uses up as much of the space given on the page – this mark will not be given if a tiny graph is plotted in the bottom left corner of the page.
L stands for Line: when plotting experimental data in Biology, it can never be wrong to join each point to the next with a straight line. This “dot to dot” plotting does not allow you to read off the graph to find intermediate values, but does best show the trend in results. But read the question carefully – the examiner may want you to plot a “line of best fit” or a freehand curve through the points. If they don’t explicitly mention it, get a ruler and join dot to dot with straight lines.
A stands for Axes: have you plotted the axes the correct way round? This often foxes students as they don’t see why it is so important. But there is a correct way of plotting a graph. The thing that you have measured in your experiment (the dependent variable) always goes on the y axis. The thing that you have altered in your experiment (the independent variable) always goes on the x axis.
A stands for Axes (again): this mark is for labelling your axes correctly. Everyone puts the numbers on the axes but often students leave out units and so lose the mark. Remember to always add the units to every axis you plot!
P stands for Points: this mark is for correctly plotting the points on the axes you have drawn – now what could be simpler than that!
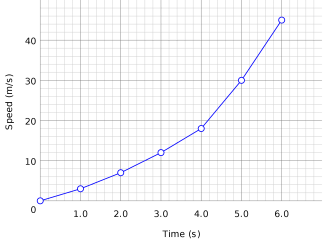
A well plotted graph that would score 5/5 on an iGCSE question. They have measure the speed of a car starting from rest for 6 seconds – perhaps it’s not a car but a rocket…. 40m/s after 6s sounds like impressive acceleration to me!
Finally a comment about the difference between precision and accuracy when analysing experimental data. In an ideal world you want your data to be precise and accurate but understanding the difference between the two can be really important….
I think that Precision is to do with how data is measured. Precise data is clustered closely together. If you measured the time it takes for a reliable experiment to happen with a sundial, the data would be very imprecise. The same experiment, measured with a stopwatch would generate precise data. If asked how to improve the precision of an experiment, the first thing to look at is how is the dependent variable being measured?
Accuracy is how close your measured value is to the “true” value. If you are trying to kick a football into a goal and you always hit the left hand post, you are not accurate but you are precise! Accuracy can often be improved in an experiment by controlling other variables better.


hi sir, i was wondering if u could kindly tell me how to plot this graph
file:///C:/Users/fahima/Downloads/4BI0_1B_que_20110519%20(2).pdf
question number 7b
Hi – I am not happy clicking on links on comments I’m afraid. Please tell me what the question is in another comment and I will have a look at it for you. Thanks.
Paul, thanks so much for this site. We are homeschooling our children, and live in South Africa. My daughter wrote her IGCSE last year, and scored excellent marks in Biology, but to my dismay the syllabus changed and now I have to redo all my Biology notes – hence your blog comes in real handy. Please continue with your great work.
I’m pleased you are finding the site useful!
Hi! I’m doing my igcse bio in 8 days I’ve finished the syllabus. And only done 6 past papers so far. My problem is I know the material very well but sometimes the marks heme needs points that I just don’t see how I could think of.what is your advice to me and what do u think I should be doing in those 8 days?
Thanks
Yee Lang ((p.s that’s the date we do our exams on in Japan! ) also there’s this really tricky suggest type question about deep vein thrombosis! How are we supposed to k l2 about it? It’s not in the syllabus?! What advice would you give me when answering these questions (novel ones- I think they’re called?)
Hi Yee Lang – I don’t think there is anything apart from the obvious to say about the last 8 days of your revision… The best way to keep the knowledge fresh is to do as many past papers as you can. There are more the 6 available on the EdExcel website (if that is the exam board you are doing)
Remember that a mark scheme is not the same as a model answer, so there will be things on every markscheme that very few candidates will know about. A mark scheme has to credit every possible correct answer so don’t worry at all if there are things you don’t know on a mark scheme. The important thing is that you can generate an answer that will score high marks.
The questions about “unusual” questions on things you haven’t encountered is that they can only expect you to know material from the syllabus. So don’t worry if you know nothing about DVTs – they don’t expect you to! You should know about veins (structure and function) and a little about blood clotting and this will be all the information you need to answer the questions. So my advice is to take a moment to think which bits of the syllabus are linked into the question, to go through the understanding you have and then try to apply this understanding to a new concept. Good luck!!
Oh okay thanks
The thing is, the question asks: suggest why blood flow is slow when there is a lack of movement. It is on an edexcel igcse paper 1 June 2013. Now the answer is supposed to be that lack of muscle contraction means that blood isn’t squeezed… are we supposed to apply this from the fact that for blood to move from the heart to the body, the walls of the ventricle must contract? It seems a bit irrelevant to me though
Have a read of this post on veins: https://pmgbiology.com/2015/02/15/blood-vessels-a-understanding-for-igcse-biology/
It is not the lack of muscle contraction in the heart that is important here. The contraction of the ventricles is responsible for the movement of blood in arteries, but all the pressure is lost as the blood passes through capillary beds so the heart cannot push blood through veins. But because veins have thin walls, they are easily compressed by the contraction of skeletal muscles. When combined with the valves in veins that prevent back-flow, contraction of skeletal muscles (due to movement of the body) helps to push blood back to the heart in the veins.
Hope this helps.
Hello. Can you please explain whether sewage increases the number of bacteria due to it having bacteria or because bacteria respire the sewage and so multiply? Also is saprotrophic nutrition the way all decomposes break down food? And how come decomposition releases mineral ions when bacteria respire and the product of that is carbon dioxide? Thanks and sorry for the long post. .
Untreated sewage will contain lots of bacteria and other microbes. But the way sewage increases the numbers of bacteria when it gets into water is that the population of decomposer bacteria that live in the water will increase massively due to all the extra organic material for them to break down. Saprotrophic nutrition is the way all decomposers break down food matter. Good question about the mineral ions – when amino acids/proteins/DNA are broken down by bacteria for use in respiration, there will be nitrate and phosphate ions produced as waste products of this process.
THANK YOU SIR!!!